Modelled · this is the business case, not a measured result
Every figure below is a target from the analysis, against a stated baseline and a formula shown further down this page. Nobody re-measured Dawood afterwards. The claim is the case, not the outcome — and the case is what I was engaged to produce.
Cost avoided · modelled case
67% ↓
Urgent-buy exposure, 15% to 5% of purchase spend
Process improved · modelled case
50% ↓
Expiry write-off, 3.0% to 1.5% of purchase spend
Mohamad Arshad · Business Development Manager, Dawood Flour Mill & Provision Pte Ltd · LinkedIn recommendation, 12 June 2023
The problem
Reordering ran on one buyer’s judgement. Stock expired unsold while urgent purchases were paid at a premium.
My contribution
What I personally did on this
Owned
Current-state analysis · requirements · the benefits case
Collaborated with
The implementation partner
Did not own
The build and the implementation. That was the partner’s scope
What was delivered
The brief arrived as a sentence. It left as an argument.
What existed before
A wish: “we need a better ERP because stock is manual”
Two recurring losses everyone knew about and nobody had costed
A preferred vendor with no comparison behind it
Replenishment logic held in one person’s head
No definition of what “working” would look like afterwards
What the engagement produced
A root-cause model that separates the symptom from the cause
A benefits case: baseline × formula × control × owner × date
Three routes scored on eight criteria — 35, 67 and 96 of 100
Ten requirements, each with a test written before build
An inventory policy, new SOPs and a gated 14-week plan
Workflow analysis
Where the bottleneck lived
Before
Demand appearsA sale, a batch plan, or a shelf that looks low
→
⚠ Bottleneck
The buyer estimates the quantity
Guess high and it expires. Guess low and you pay a premium.
→
Purchase order raisedUrgency depends on when somebody noticed
After
Demand and recipe requirementSales plus what production is scheduled to consume
→
✓ Rule
MRP nets it against reality
On hand, committed, open orders, safety stock, real lead time
→
✓ Judgement, kept
Buyer reviews a recommendation
Overriding it is allowed. Overriding it without a reason is not.
Ongoing, without a consultant in the room
The month closesVariance, expiry exposure and supplier performance recorded
→
✓ Feedback
Last month’s result changes next month’s parameters
Purchasing owns the settings. An unowned parameter goes stale in a quarter.
The distinction that made the redesign acceptable to the buyer
The new process does not take the decision away from the person making it. It removes the information gaps that were forcing them to guess. That is the difference between a control and an obstacle.
Notes
What shaped the decisions
Scope, stated plainly
Discovery, requirements, the options appraisal, the operating model, the SOP redesign, the acceptance criteria and the benefits framework are mine end to end. Configuration, migration and defect resolution belong to an implementation partner, and I did not run them. A case study that quietly claims the whole project is easier to write and much easier to catch.
Requirements
What they needed, and why it mattered
Ten were written and prioritised. These five carry the business consequence, and each consequence shows up in the numbers at the top of this page.
01
One stock position, by item, batch and bin
One record showing on hand, committed, available and on order — replacing the shelf walk, the spreadsheet and the colleague who happens to know.
Every other requirement here is worthless if the underlying number is not trusted. This one has to be true first.
BR-01 · Must · client-specified
02
Batch and expiry captured at goods receipt
For expiry-controlled ingredients, the lot and its date are recorded when the delivery is accepted, not written on the sack and hoped for.
Shelf life visible only on packaging is invisible at the two moments that matter: buying and picking. Without this the write-off target is unreachable.
BR-03 · Must · derived from the expiry failure mode
03
Replenishment triggered by a rule, not by a person noticing
Reorder point, min and max levels, safety stock and measured lead time, netted by MRP into a recommended quantity, with an override that requires a reason.
The one requirement that closes both failure modes with a single control. Also the only one that survives the buyer being on leave.
BR-05, BR-06 · Must · derived from the root cause
04
Production consumption posted against the order that planned it
Material issued against a production order, extra usage logged as an additional issue with a reason rather than by quietly editing the recipe, and output received back against the same order.
Otherwise material walks off the shelf and the difference dissolves into next month’s purchase total, where a two-kilo overrun per batch is invisible.
BR-07, BR-08 · Must · derived from the yield question
05
Supplier lead time retained as a planning input
Lead time calculated from order date to receipt date, with on-time-in-full, price variance and rejection rate per supplier — built from purchasing data, not a separate vendor platform.
A cheaper supplier who delivers late forces either more safety stock or more urgent orders. Reliability is an inventory parameter, and headline price hides it.
BR-09 · Should · derived from the urgent-buy analysis
Method
Seven stages, and the software only appears at stage four
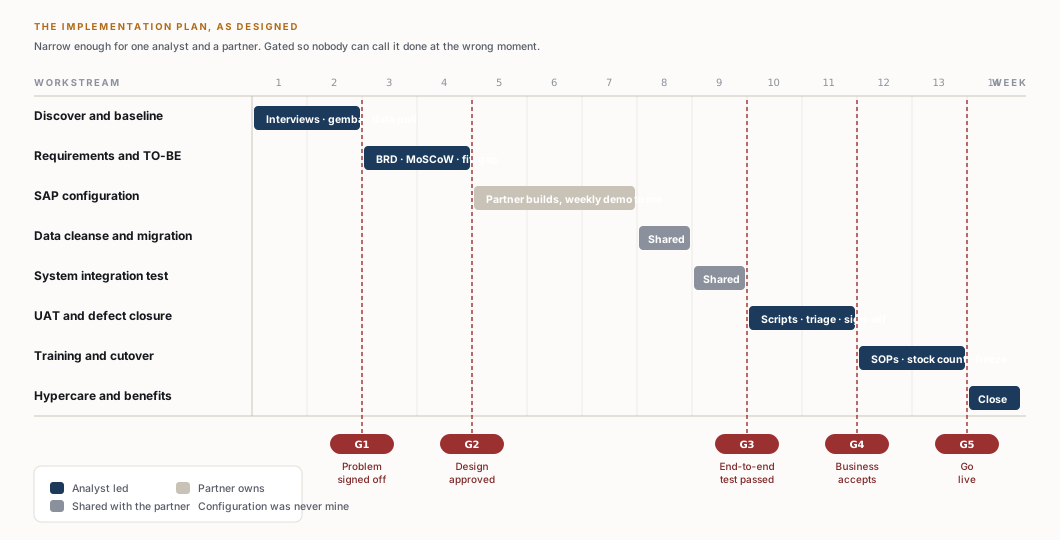
A deliberately light lifecycle, sized for a ten-person business rather than an enterprise programme. The ordering is the argument: nothing about a system is decided until the operation has been understood, the problem has been priced and the requirements have been written down.
The 14-week plan as designed, shaded by who owns each stage
01
Discover. Interviews across management, purchasing, warehouse, production and finance, plus a walk of the floor. Each function was asked the same underlying question: where does your information stop being trustworthy?
02
Diagnose. An AS-IS map, a five-why chain and an issue tree, run until the symptoms converged. Five separate gaps resolved to one cause, which is what stopped the project becoming five small fixes that each change nothing.
03
Define. A problem statement, ten requirements prioritised by MoSCoW, and an acceptance criterion written for each one before any solution was named — so the test could not be quietly reshaped to fit whatever got built.
04
Design. Only now does technology enter. Three routes scored against eight weighted criteria, then the target operating model, the ABC/XYZ inventory policy, the redesigned SOPs and the supplier scorecard.
05
Measure. A benefits register with a formula, an owner and a review date for every line, reviewed at day 30 for adoption, day 60 for planning quality and day 90 for money. Go-live is not the finish line.
Findings
Seven questions, answered in order
Each analysis below answers one question, and each answer is what made the next question worth asking. The diagrams are the working, redrawn for this page from the engagement’s own analysis.
01What was the process actually doing?
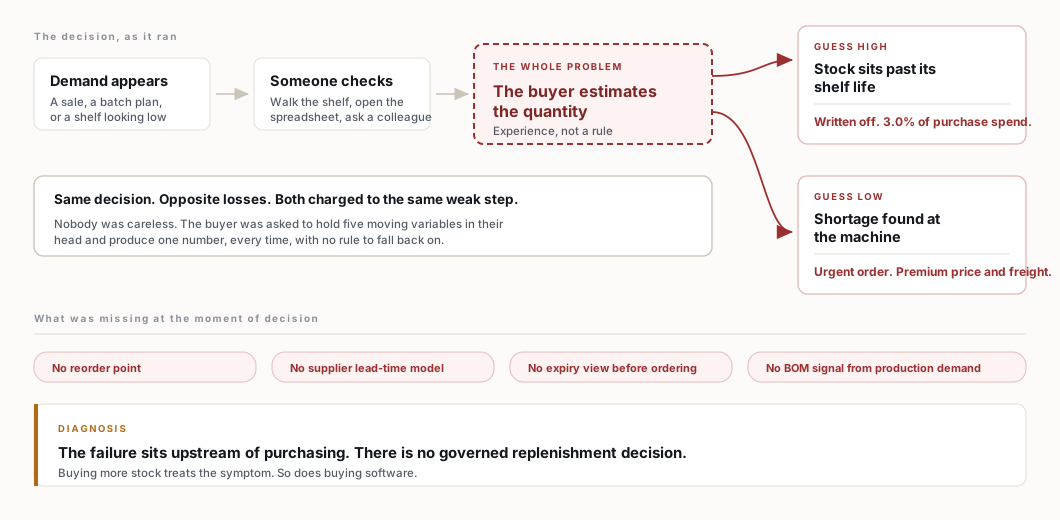
AS-IS replenishment: one estimate, two divergent cost paths, four absent controls
What it showed
Overstock and stockout look like opposite problems and get treated as two projects. They are not. They are the same estimate landing on either side of correct, which means any fix aimed at one of them makes the other worse — carry more stock and expiry rises, carry less and urgent buying rises.
Drawing them as one decision rather than two flows is what reframed the brief. The question stopped being how much stock should we hold and became what should the buyer be looking at when they decide.
02Was the problem inventory, or the decision behind it?
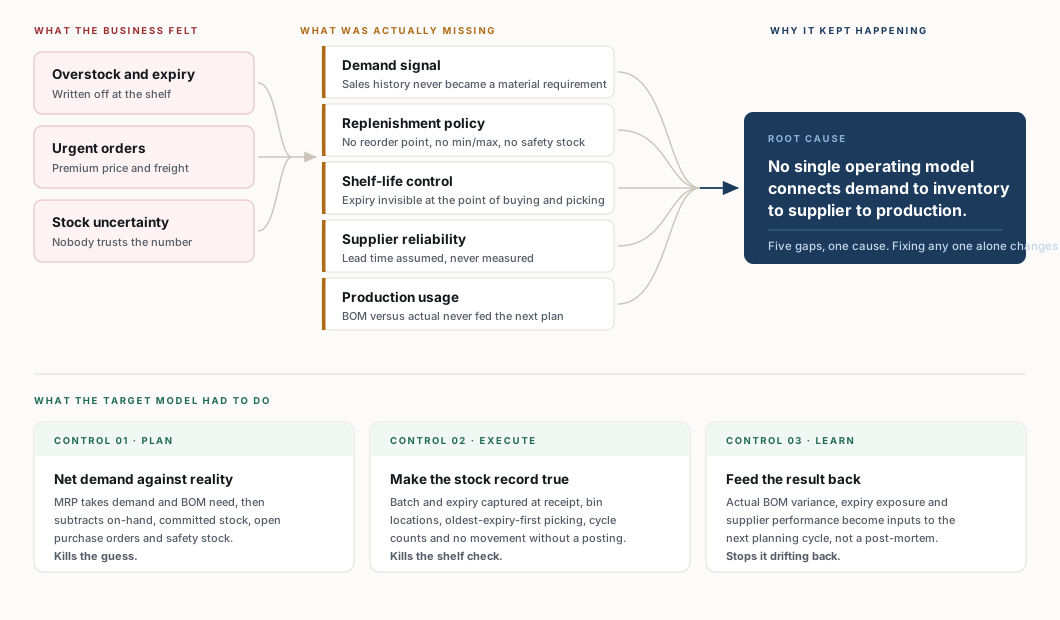
Issue tree: three felt symptoms, five missing controls, one root cause
What it showed
Five things were missing — a demand signal, a replenishment policy, shelf-life visibility, measured supplier reliability and a production-usage feedback. Individually each looks like a small housekeeping gap. Together they are one thing: no operating model connects demand to inventory to supplier to production.
This is the finding that determined scope. Fixing any single gap alone changes nothing measurable, which is the honest reason a spreadsheet upgrade was never going to be enough — and equally the reason the ERP scope had to stay narrow rather than sprawl into full digitalisation.
03Was SAP the right answer, or just the requested one?
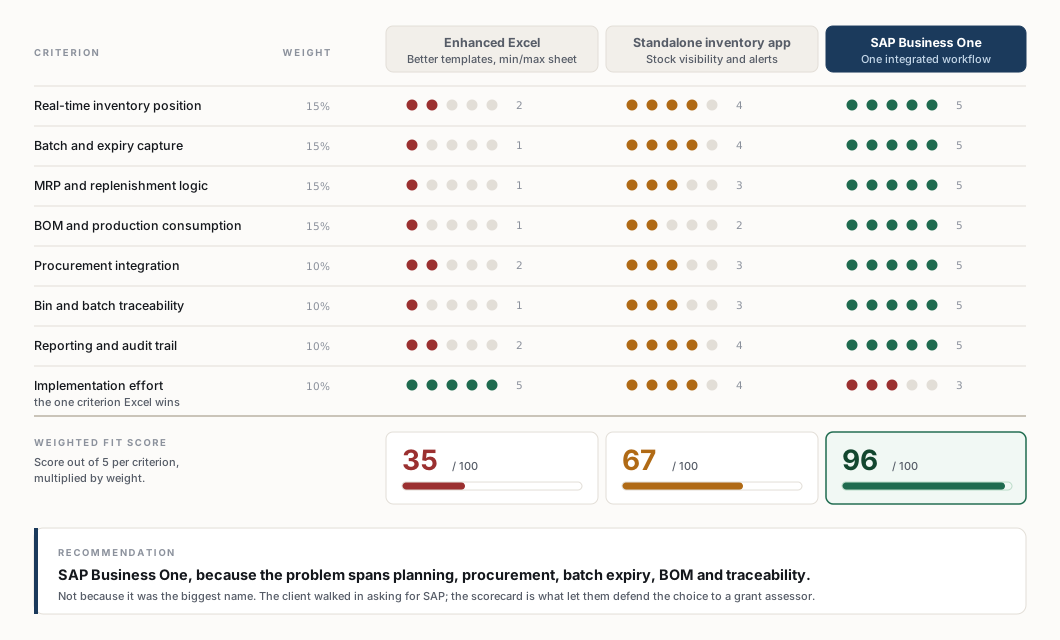
Eight weighted criteria, three routes, scored independently before recommending
What it showed
The client had already decided they wanted SAP. Scoring it anyway was the point — a recommendation that agrees with the client is only worth something if it could have disagreed. Enhanced spreadsheets score 35, a standalone inventory app 67, SAP Business One 96.
Note where the losing option wins: implementation effort, where the spreadsheet scores 5 and SAP scores 3. Publishing the criterion the recommendation loses on is what makes the other seven believable, and it is what an assessor looks for.
04What does a controlled version of this business look like?
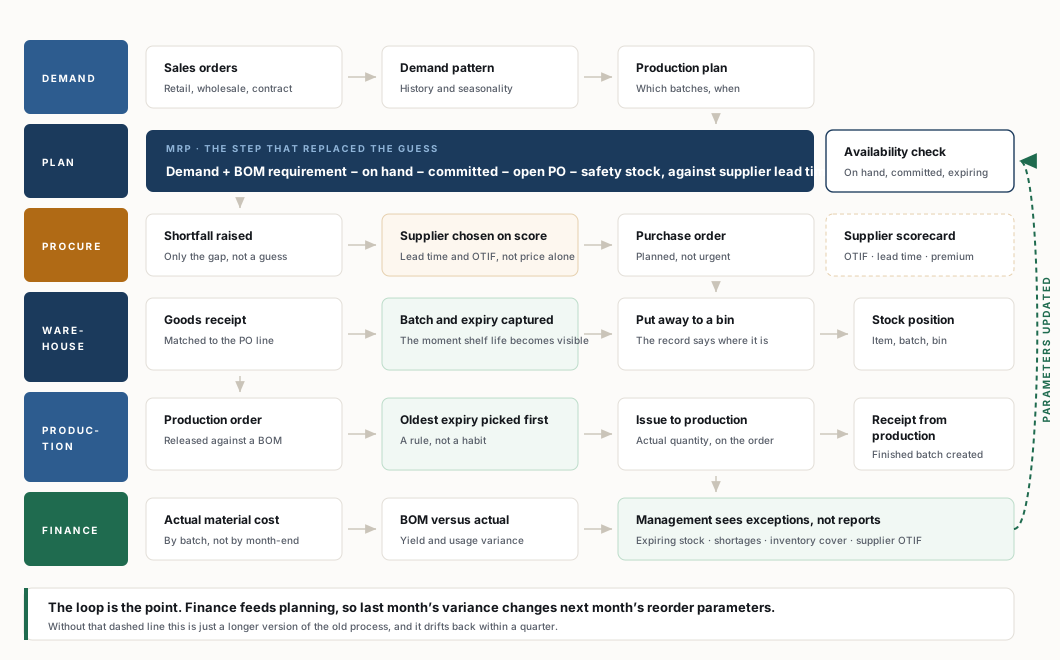
Target operating model — six lanes, one closed loop
What it showed
The target state is more complex than what it replaces, and pretending otherwise would be dishonest. What keeps it usable for a ten-person business is that each individual action stays simple: receive against the order, record the batch, pick the oldest, post the issue.
The dashed return line is the part that is easy to leave out and fatal to leave out. Finance feeds planning, so last month’s variance and supplier performance change next month’s reorder parameters. Without it this is a longer version of the old process, and it drifts back inside a quarter.
05How does a production batch become a purchase order?
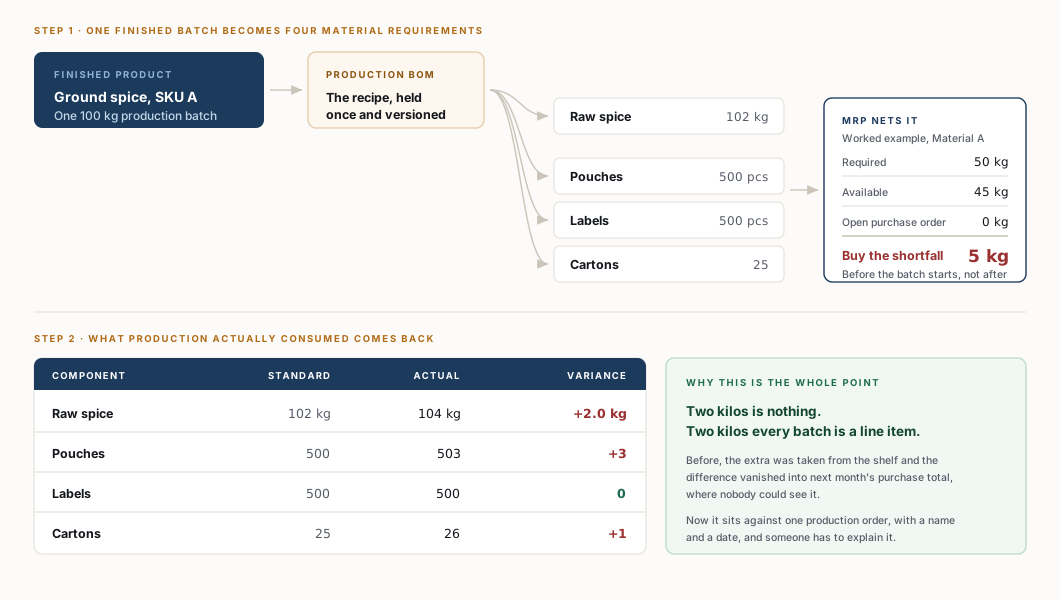
Recipe explosion, netting to the shortfall, and the variance that comes back
What it showed
This is the mechanism that makes the whole case work, in one diagram. A finished batch explodes into its components, MRP subtracts what is already on hand and on order, and only the shortfall gets bought — before production starts rather than after the shelf is found empty.
The return leg matters just as much. Two kilos over on a batch is nothing; two kilos over on every batch is a line item. Posting actual consumption against the order that planned it is what drags that number into the light, attached to a date and a name, instead of dissolving it into an aggregate purchase total where no one can see it.
06Should forty-plus materials all be controlled the same way?
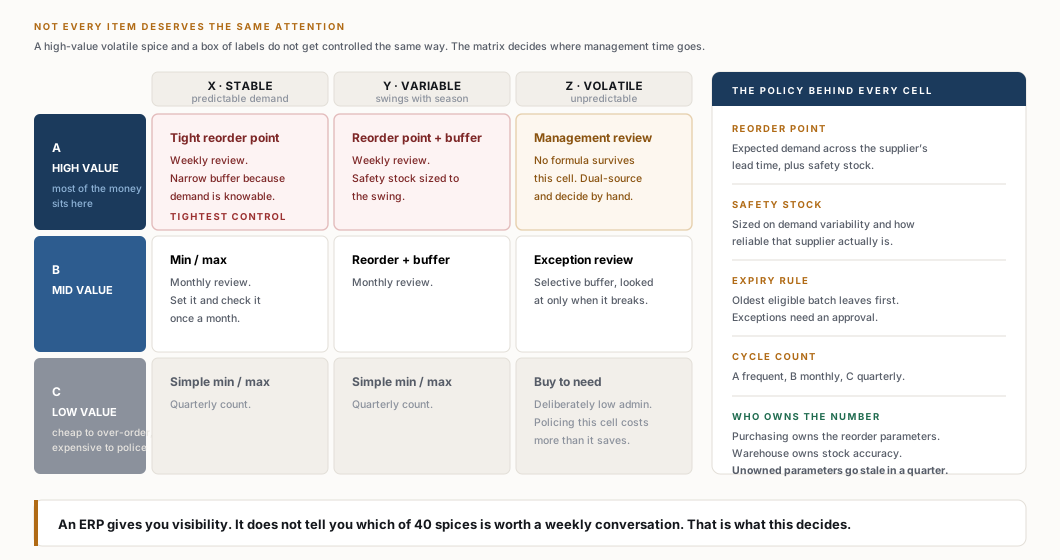
ABC/XYZ segmentation and the policy that sits behind every cell
What it showed
No, and treating them equally is how control systems die. A high-value volatile spice needs a weekly conversation. A box of labels needs a minimum, a maximum and to be left alone. Policing the bottom-right cell costs more in admin than it ever recovers in stock.
The right-hand column is the part that outlives the project: who owns the reorder parameters, who owns stock accuracy, who approves an exception. Parameters set once at go-live and owned by nobody are stale within a quarter, and then the buyer quietly goes back to estimating.
07How do you stop “configured” being mistaken for “solved”?
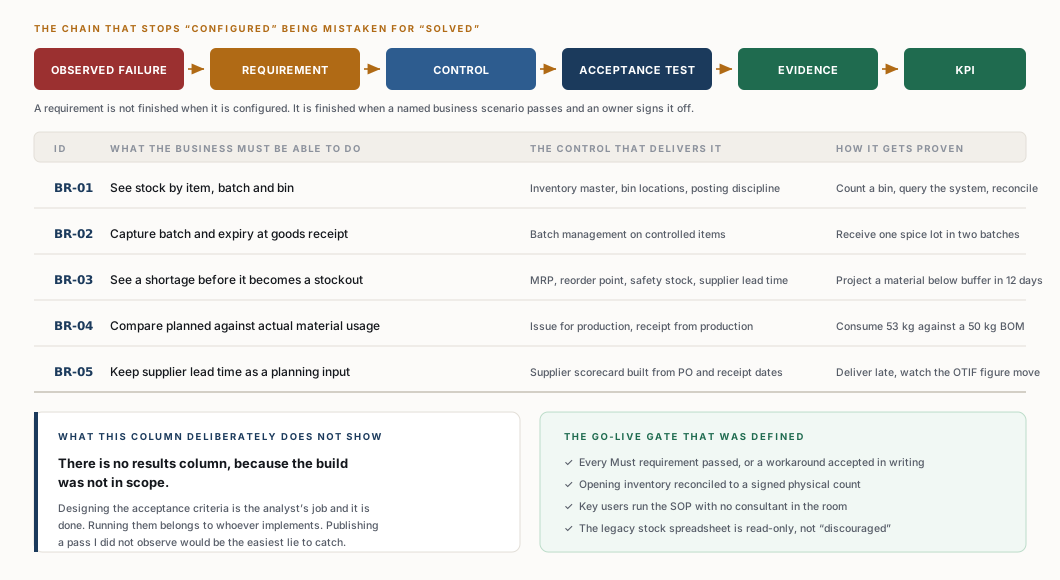
Traceability: every requirement carries the business scenario that would prove it
What it showed
A system can be fully configured and still leave the original problem untouched. The defence is writing the acceptance test at the same time as the requirement, in business language: receive one spice lot in two batches, consume 53 kilos against a 50-kilo recipe, deliver late and watch the supplier score move.
There is no results column on that diagram, and the omission is deliberate. Designing the acceptance criteria was my work and it is finished. Running them belongs to whoever implements. A pass I never observed is the easiest claim in a portfolio to check and the worst one to be caught on.
Why this is the finding, not a footnote
Seven analyses, one argument: the business did not have an inventory problem, it had an unowned decision. That reframe is what turned an open-ended software request into a fourteen-week scope with a price, a gate at every stage, and a defined way to tell afterwards whether it worked.
The result
What the case commits to
Five benefit lines, each with a stated baseline, a modelled target and a formula behind it. Published this way so anyone can rerun the whole thing with Dawood’s real figures during discovery. That was always the intent: not to be right about the improvement in advance, but to make it falsifiable.
The modelled benefit lines · each one is baseline × formula × named owner
Benefit line
Baseline used in the model
Modelled target
Expiry and write-off
3.0% of purchase spend
1.5% — a 50% reduction
Urgent purchasing
15% of purchase spend
5% — a 67% reduction
Manual stock and reconciliation effort
48 hours per month
20 hours — 336 hours a year released
Unexplained production usage variance
2.0% of material consumed
1.2%
Average inventory held
the running average value
15% lower, with service levels held
Why the split matters more than any single figure
One headline improvement is unusable, because the first question an owner asks is where it came from and the second is what would have to be true for it to be wrong. Five lines with visible baselines answer both. It also means that if discovery finds the real write-off rate is 1% rather than 3%, the case shrinks honestly instead of collapsing — and the recommendation becomes reduce the scope, not force the project through.
The distinction I would not let anyone skip past
These five are not all the same kind of benefit. Inventory held is working capital — cash that stops being tied up, a balance-sheet effect that happens once rather than a saving that repeats every year. Hours released only become a saving if the time is actually redeployed. Both are kept separate from the recurring lines throughout, because rolling everything into one figure is the most common way an ERP business case quietly becomes untrue.
What shipped
What produced each result
Three deliverables. Two of them map directly to a number at the top of this page; the third is what makes either of them checkable.
Produced the 67% ↓
The replenishment control design
MRP netting, reorder point, safety stock and measured supplier lead time, specified as a decision rule the buyer follows rather than a screen they are told to visit. Overrides stay available and become visible, so exceptions get reviewed instead of hidden.
Produced the 50% ↓
The batch and expiry control
Capture at goods receipt, oldest-eligible-batch-first written into the picking SOP with an approval path for exceptions, and a 30/60/90-day ageing list reviewed weekly with a named action per line: consume, transfer, promote or return.
Produced the measurement
The benefits framework
A baseline, a formula, a system control, a named owner and a review date against every line, with the checkpoints fixed at day 30 for adoption, day 60 for planning quality and day 90 for outcome. Without this the other two are opinions.
What I would do differently
The business case rests on illustrative planning assumptions, clearly labelled as such, because the engagement did not reach the two-week discovery that was designed to replace them with measured figures. Every number on this page is therefore a target, not a trophy. If I ran it again I would fight harder to get the purchase history and the write-off records in the room on day one — a case built on the client’s own numbers is a different conversation entirely, and it is the only version that ever gets checked at day 90.
Part two of two
How it was actually done
Everything above is the business read. Everything below is the method, the analysis behind each figure, and the arithmetic that makes the case checkable rather than assertable.
!Before you open this
Everything above is the bottom line. If that is what you came for, you already have it.
What follows is the full working: 9 diagrams and 7 sections of working, the analysis behind each decision, and why it went that way instead of the obvious way. It is long on purpose. It is written to be checked, not skimmed.
Only wanted the overview? Stop here. You will not miss a single result — every number is already above this line.