Twenty seconds of variation in one step costs sixteen minutes per pallet. That is the entire argument for standardisation, measured rather than asserted.
A time study is a snapshot. A written procedure is the thing that stops the operation drifting back the week after anyone stops watching.
An element-level time study that produced the cycle time and the capacity correction, and two floor improvements implemented — pallet boundary markings and speed-limit signage, both raised and closed the same month.
Five requirements. Each one has a business consequence attached, and each consequence shows up in the numbers at the top of this page.
No new systems, no software, no disruption to the line. The whole method is a stopwatch, a structured sheet, and the discipline to run it twice.
Pick the operation → split into elements → time 5 full cycles
↓
Average each element separately
↓
cycle time → × 48 cycles → pallet time
↓
Real operating minutes → cycles per day → days per pallet
↓
Run it again, change one element only
Every step asks one question, answers it with the measured data, and only then moves on.

| Cycle | Find item | Packing | Sealing | Total (s) |
|---|---|---|---|---|
| Small box 1 | 35 | 108 | 24 | 167 |
| Small box 2 | 25 | 112 | 28 | 165 |
| Small box 3 | 50 | 117 | 22 | 189 |
| Small box 4 | 41 | 118 | 32 | 191 |
| Consolidate into shipping box | 15 | 130 | 40 | 185 |
| Average | 33.2 | 117.0 | 29.2 | 179.4 |
A full cycle averages 14.95 minutes. A pallet is 48 cycles. At the real operating rate that is 2.05 days per pallet — the first cycle time the operation had ever had.
| Element | Seconds | Share |
|---|---|---|
| Packing | 117.0 | 65% |
| Finding the item | 33.2 | 19% |
| Sealing | 29.2 | 16% |
Two thirds of every cycle is a single element. Any improvement not aimed at packing is aimed at 35% of the problem — which is exactly where an untargeted efficiency drive would have gone.
| Study | Final seal | Cycle | Cycles/day | Days per pallet |
|---|---|---|---|---|
| Run 1 | 40 s | 14.95 min | 23.41 | 2.050 |
| Run 2 | 60 s | 15.28 min | 22.90 | 2.096 |
| Difference | 20 s | — | — | 16 min / pallet |
One element, changed by twenty seconds, moves the pallet by sixteen minutes. Nothing else in either study differed.
That converts "everyone works a bit differently" from a shrug into a number, and it is why standardising the seal step was the first recommendation rather than a nice-to-have.
| Minutes in a shift | Value |
|---|---|
| Shift length | 480 |
| Breaks — lunch, tea, toilet | −90 |
| Miscellaneous non-productive | −40 |
| Real operating time | 350 |
| Planning overstatement | 37% |
Planning on 480 against a real 350 overstates the day by 37%. That error does not sit still — it compounds through every pallet estimate, every promised ship date and every headcount calculation built on top of it.
None of this needed new software, new equipment or a stopped line. It needed someone to stand on the floor and measure the thing everyone had assumed.
The overstatement is not an estimate. It is the difference between the number planning used and the number the floor actually had, and both are on the study sheet.
| Basis | Minutes | Cycles/day | Days per pallet |
|---|---|---|---|
| Planned on shift length | 480 | 32.11 | 1.495 |
| Measured operating time | 350 | 23.41 | 2.050 |
| Overstatement | +37% | +37% | −27% |
Planning believed a pallet took 1.5 days. It took 2.05. Every schedule built on the first number was short by half a day per pallet, and nobody could see it because the shortfall showed up as overtime rather than as a missed number.
Nobody planned badly. They planned on shift length, which is the obvious number and the one on every roster. The 130 minutes lost to breaks and non-productive time was never subtracted because it had never been measured.
The tool was a stopwatch. What was missing was not capability, it was someone whose job that week was to question the number everyone was already using.
Three deliverables, and each one maps to a number at the top of this page.
480 shift minutes taken apart into breaks, non-productive time and real work, giving 350. Then 2.05 days per pallet against it — the first cycle time the operation had ever had. Dates could finally be promised against something measured, which is what took the overtime down.
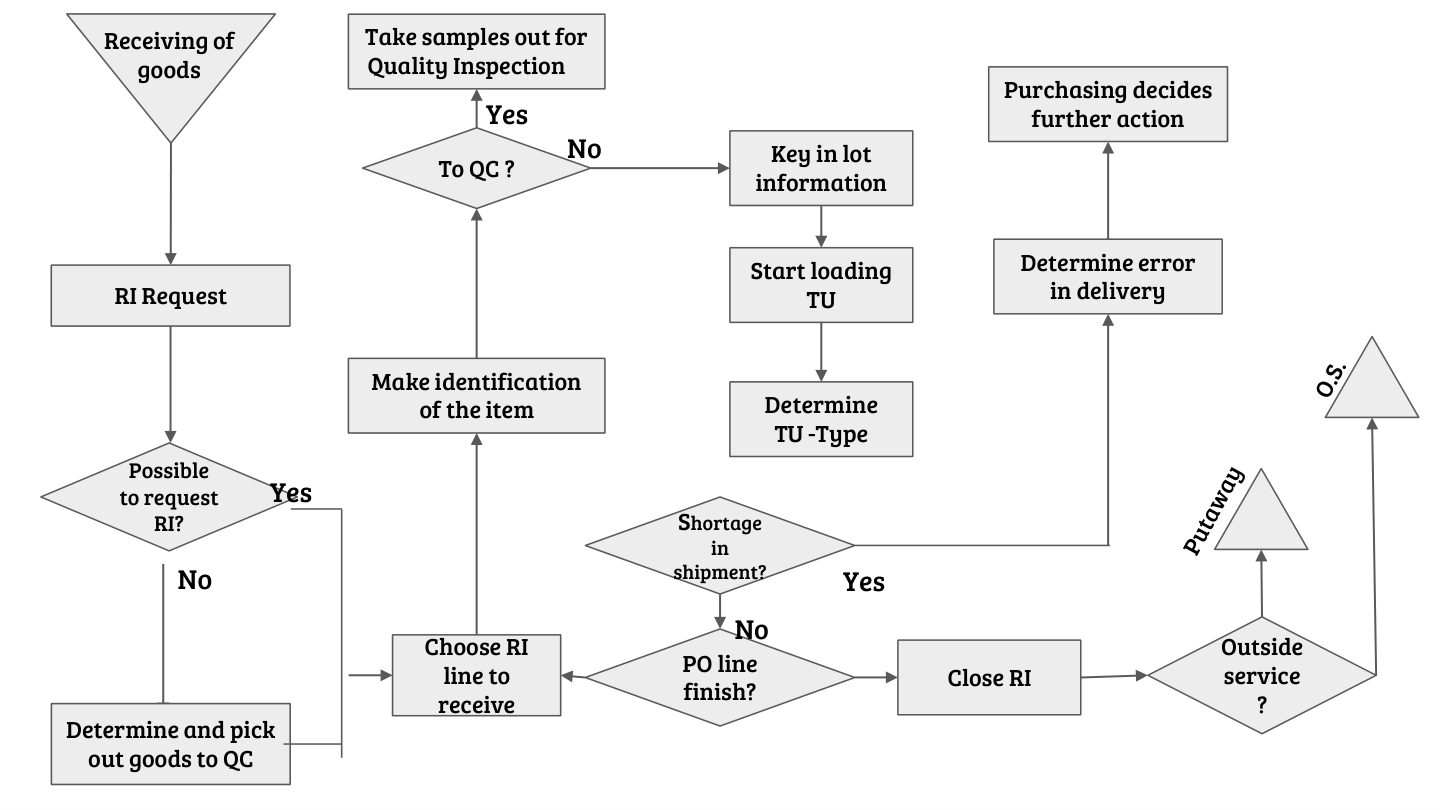
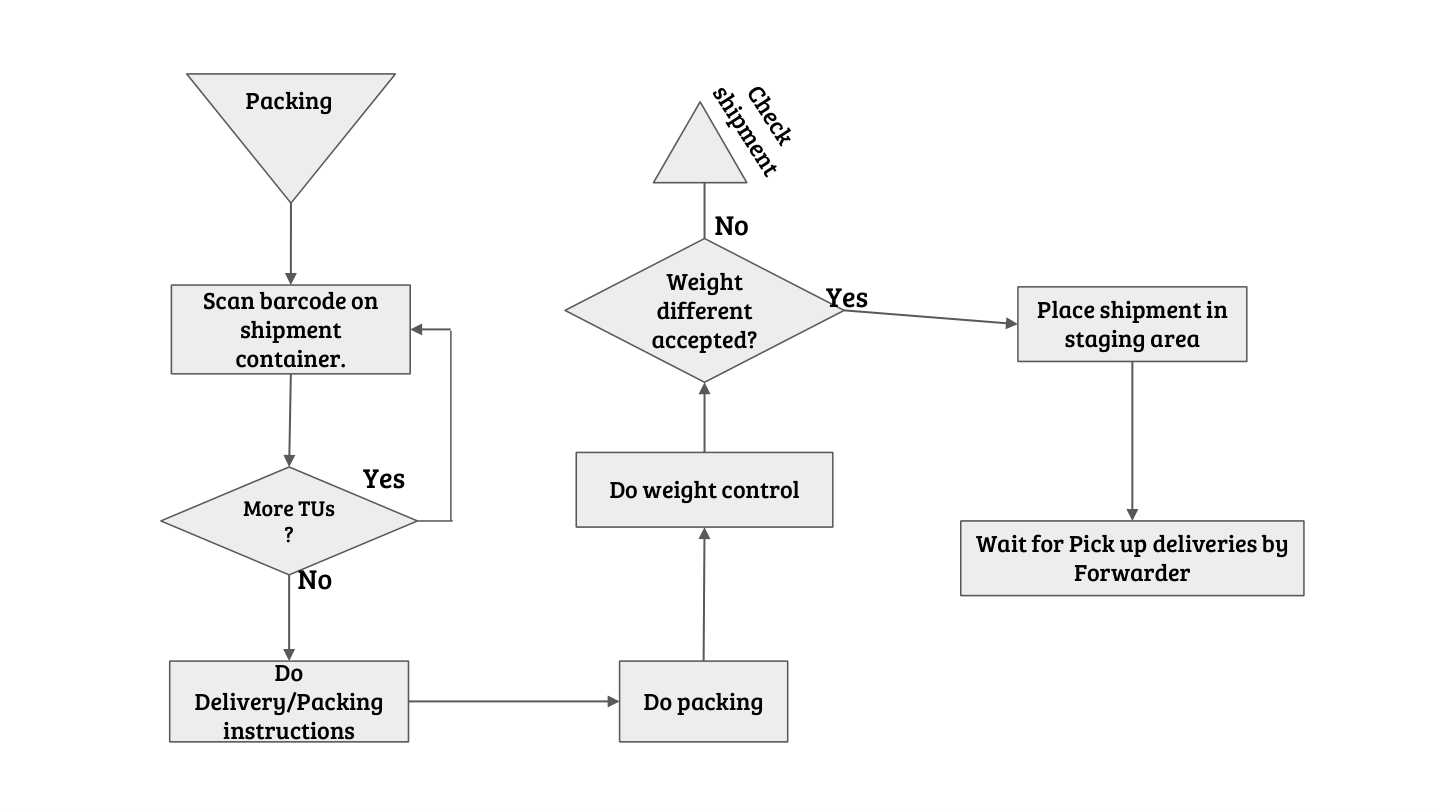
Receiving and packing documented end to end — flowcharts with decision branches, system steps, and ten numbered physical steps through to a sealed and documented box.
Two safety hazards were found while standing on the floor with a stopwatch and closed the same month: undefined pallet boundaries in the transit zone, and no speed control in a shared forklift area. Neither was in the brief.
Everything above is the business read. Everything below is the method, the raw time study, and the arithmetic that makes the numbers checkable rather than assertable.
Everything above is the bottom line. If that is what you came for, you already have it.
What follows is the full working: 3 diagrams and 7 sections of working, the analysis behind each decision, and why it went that way instead of the obvious way. It is long on purpose. It is written to be checked, not skimmed.
Only wanted the overview? Stop here. You will not miss a single result — every number is already above this line.