The process nobody had ever written down
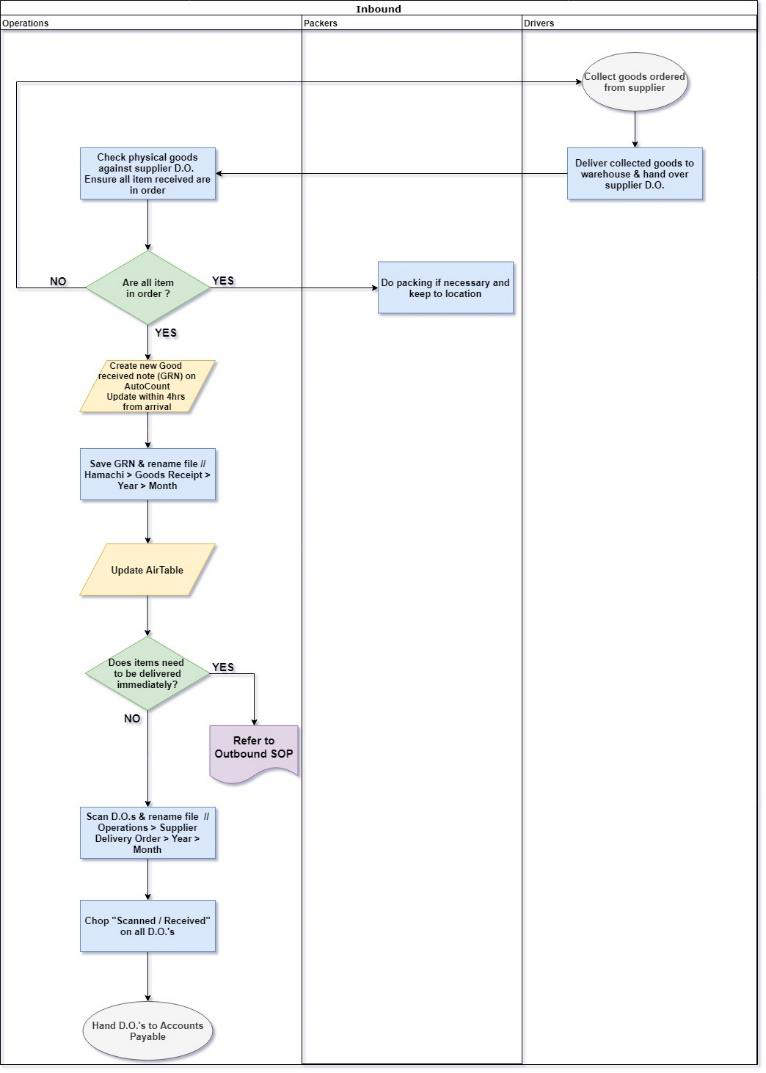
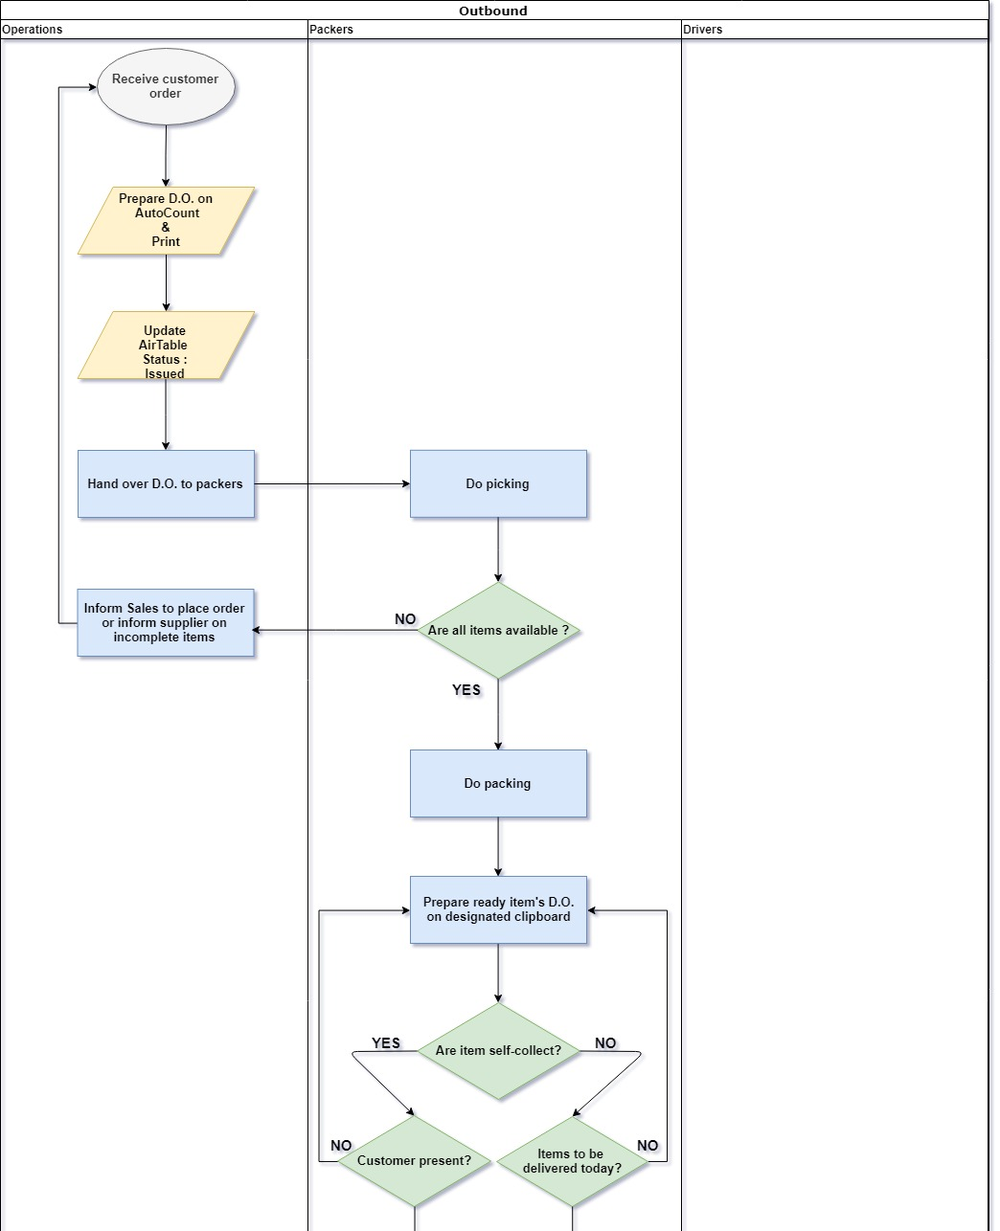
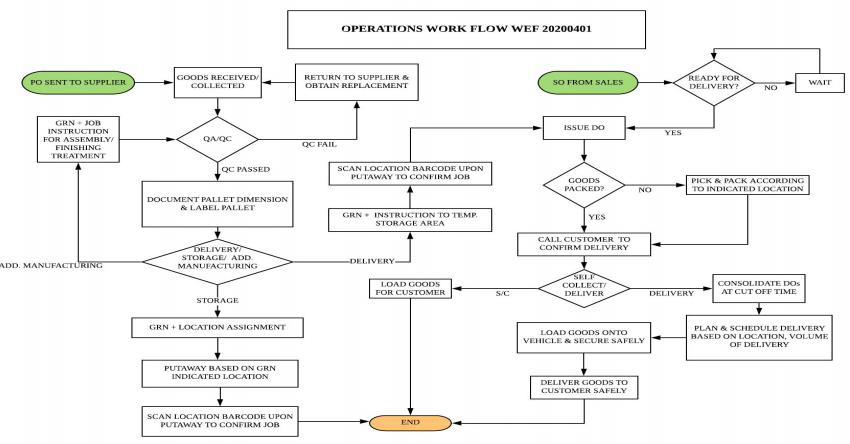
There was no SOP and no flowchart for either direction. Both of these were drafted from watching the floor, purely so there was a current state to analyse.
What shaped the decisions
The company reported four problems. They were one problem with four symptoms. A messy floor, miscommunication, duplicate ordering and duplicate deliveries all trace back to the same absence: nothing in the warehouse had a name two people could agree on.
Every item on that list is mine, end to end. I mapped the process, ran the data, drew the layout, designed the addressing schema, built the tool, wrote the SOP and delivered the training. There was no team to hand any of it to.
What they needed, and why it mattered
Five requirements. Each one has a business consequence attached, and each consequence shows up in the numbers at the top of this page.
- 01Write down the process before changing itNo SOP or flowchart existed for either inbound or outbound. Both were drafted from observation, covering the exception paths as well as the happy path.You cannot improve a process nobody has described. Mapping it was the diagnostic, and it is what turned four complaints into one root cause.Derived requirement · the blocker to everything else
- 02Give every position an address that reads like directionsWarehouse unit, then level and zone, then column and row, at a fixed character count across every location in the building.An address a stranger can follow is what removes the dependency on the person who put it there — which is the 63%.Derived requirement
- 03Decide what to keep on data, not on opinionTwelve months of movement pulled and pivoted by product code, week, total quantity and delivery-order frequency, then converted to cumulative sales and frequency percentages.Disposal is a political conversation in a family business. Handing management a ranked list makes it a decision instead of an argument, and it ran alongside stock take so no extra downtime was needed.Client-specified · management made the call
- 04Deliver it without stopping the warehouseA twenty-person company living on daily transactions could not pause to be reorganised. Everything ran in phases around live operations.Then Singapore's Circuit Breaker closed the site mid-project and reopened it at reduced headcount. Phasing is the only reason the work survived that rather than being abandoned.Constraint
- 05Make it survive the people who did not want itMultiple owners who did not share the same direction, long-tenured staff who saw no need to change, and operators who refused the new SOP outright.A process only its author follows is not a process. Repeated meetings and training were the deliverable as much as the schema was.Constraint · the real difficulty of the project
Five phases, each one producing what the next one needed
Not a tidy-up. The order could not be shuffled, and Set in Order needed four phases of its own before a single label went on a rack.
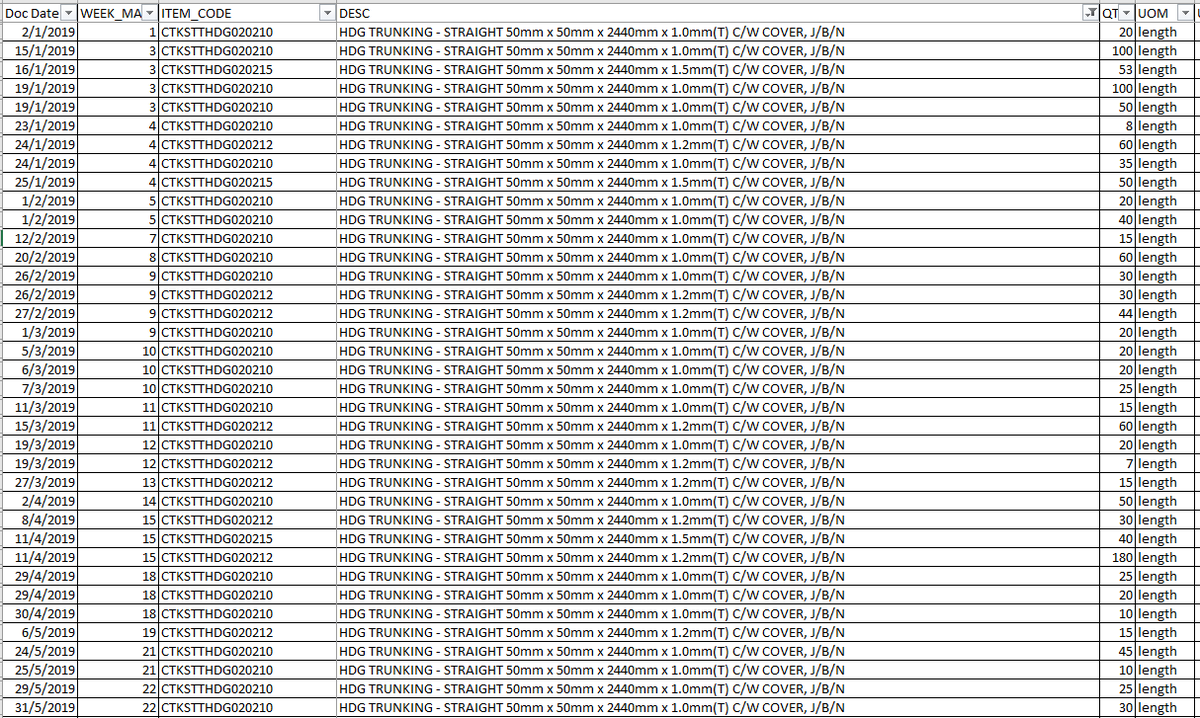
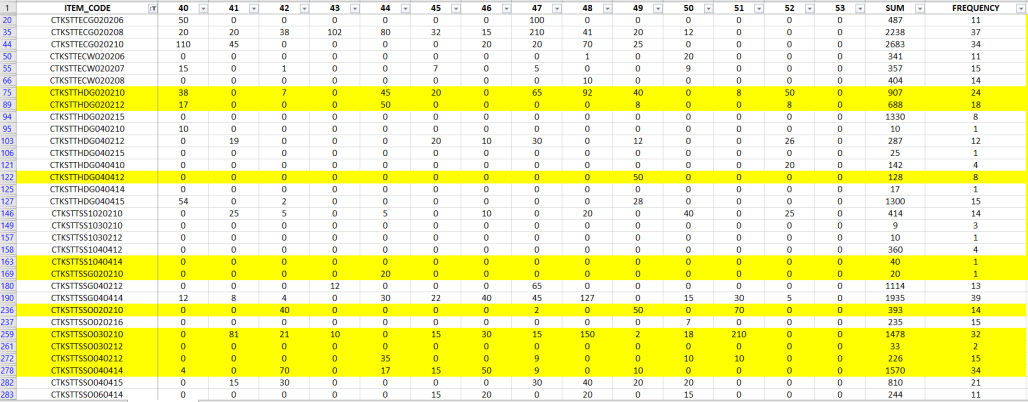
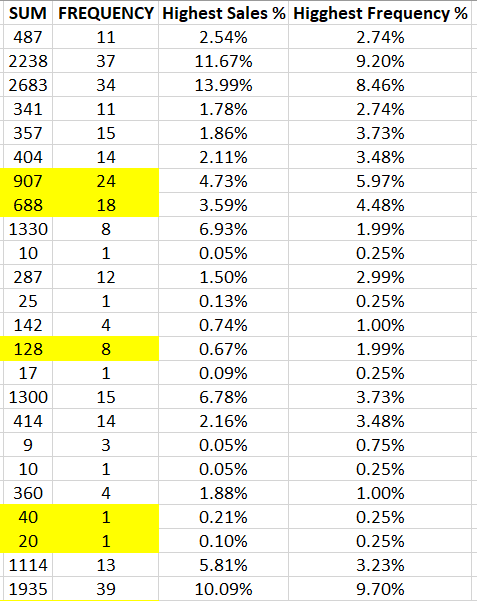
Sorting a warehouse on opinion produces an argument. Sorting it on twelve months of movement produces a ranked list, and management makes the call rather than defending it.
Phase two ran alongside the stock take, so dead stock was identified and live stock counted and located in a single pass. No extra downtime.
This is the analysis the 27% comes from. The warehouse was full, and the working assumption was that the business had outgrown it and needed a second unit. The ranked list said otherwise: a substantial share of the floor was held by items with almost no movement across the whole twelve months. Clearing them reduced inventory held by 27% and released the space that had supposedly run out. The second unit was never rented.
Worth being precise about what that means commercially. Twenty-seven percent less stock is cash the business is no longer holding on a shelf, and it recurs. Avoiding the second unit is rent, deposit, fit-out and the staff time to run two sites, and that avoidance came from a spreadsheet rather than a capital decision.
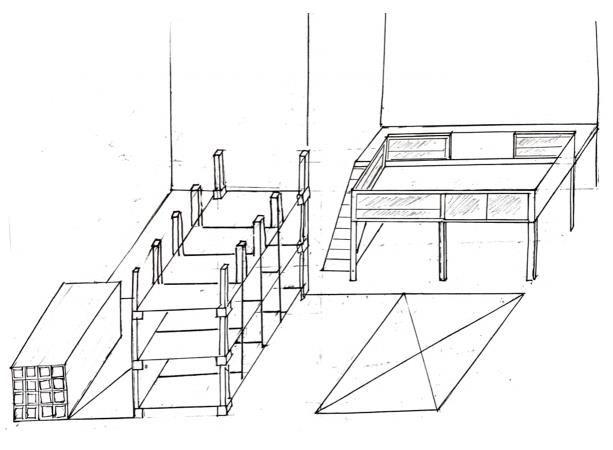
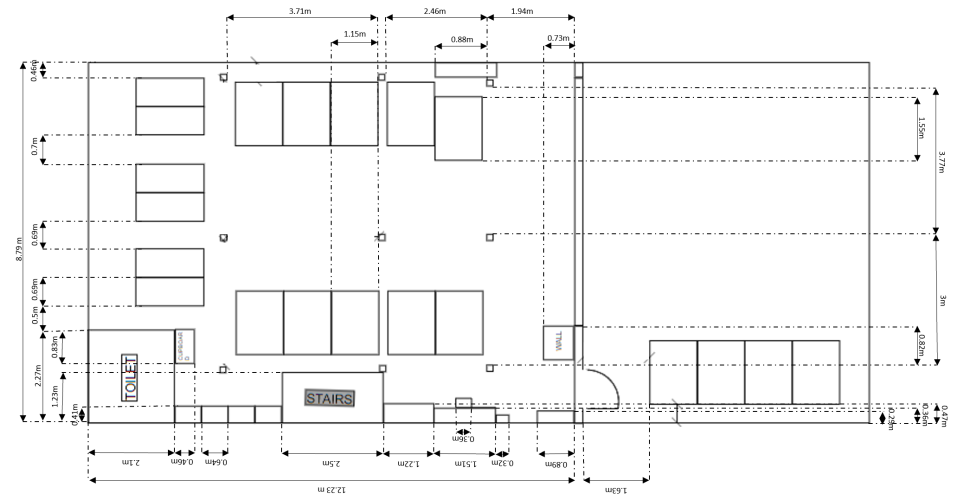
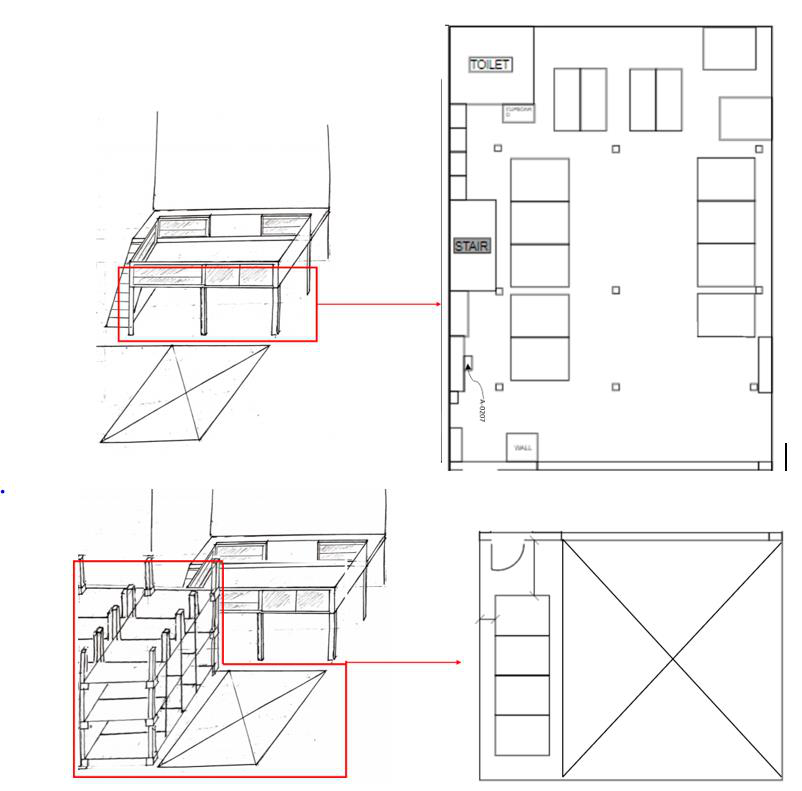
The concept exists to get a decision out of several owners who did not share a direction. The measured version exists to be built from. Skipping the first means arguing about millimetres before anyone has agreed on the shape.
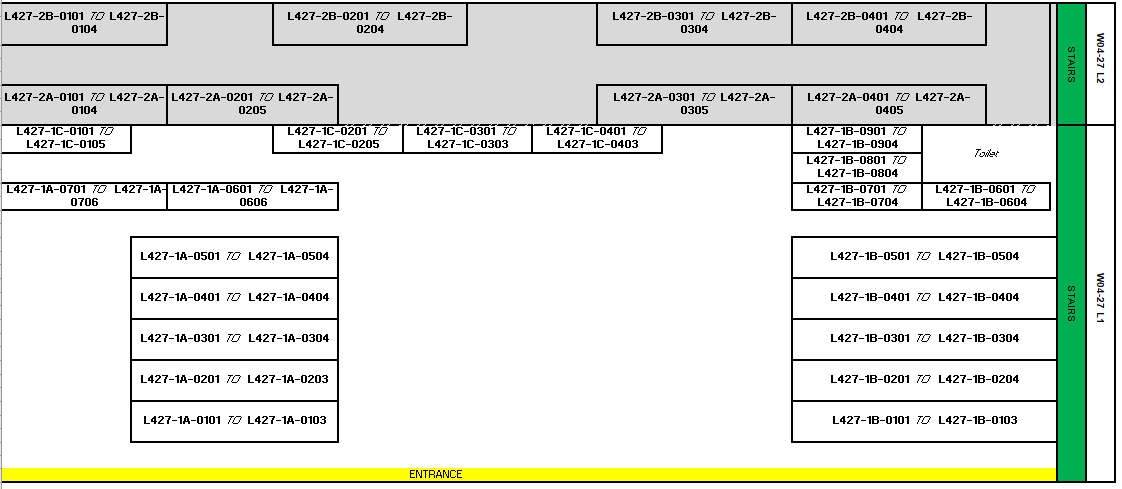
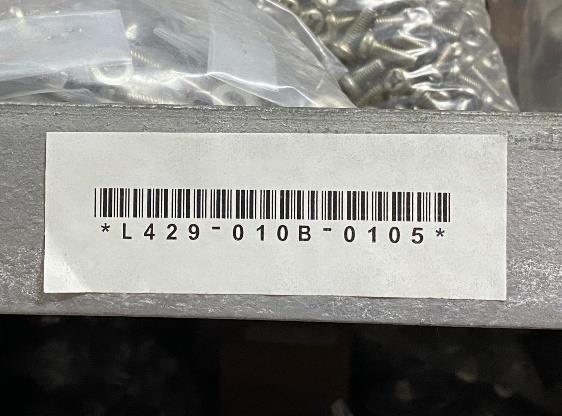
L427 – 1A – 0101 is warehouse unit, then level and zone, then column and row — the order a person physically walks it. The code tells you which building, which floor, which aisle, which shelf, in that sequence.
The character count is standardised across every location, which is what makes it sort, scan and print predictably at volume.
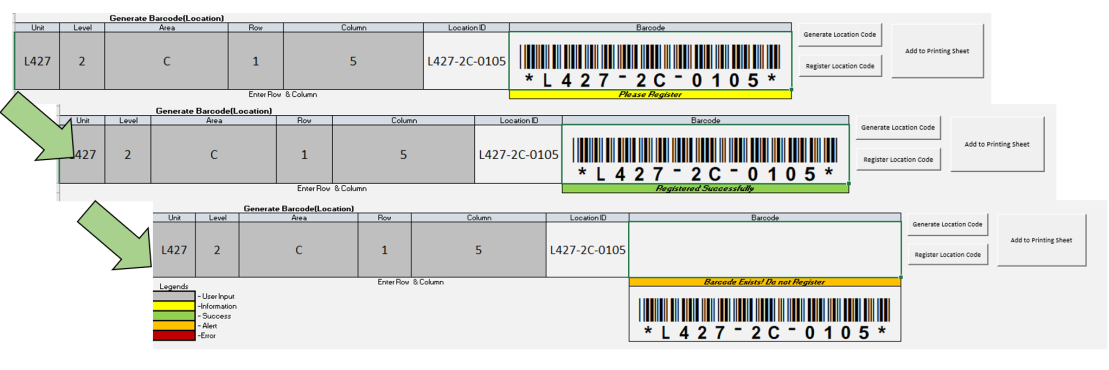
Mass-producing IDs by hand loses track of what has been issued, and a duplicate address reintroduces the exact ambiguity the whole project existed to remove. The register refuses a code that already exists instead of silently overwriting it.
The colour legend is there because the people using it did not want the change. A tool that tells you plainly what state you are in is a tool that gets used.
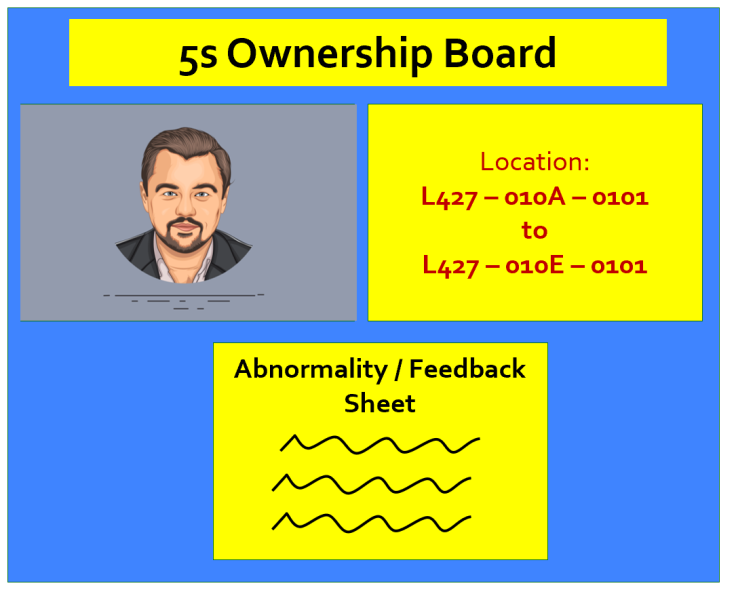
The first cycle count found discrepancies and they were unresolved when the engagement ended. The ownership board was accepted in principle and never finished. Both are here because leaving them out would make the rest less believable.
What it actually looked like
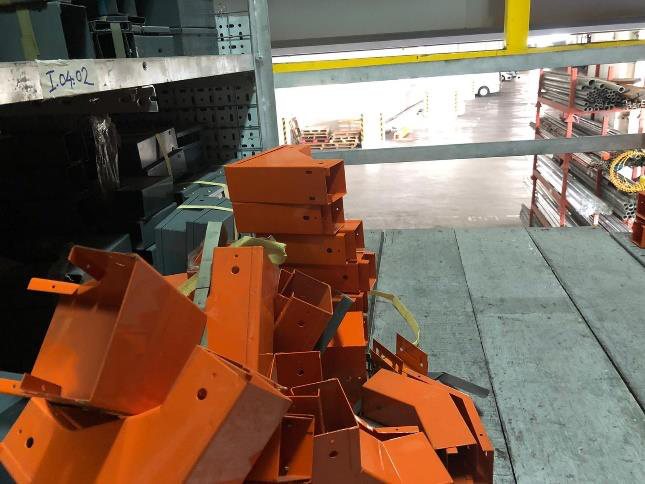
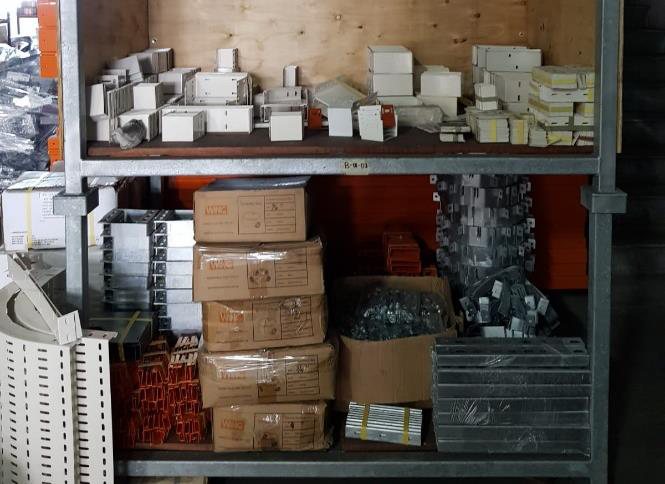
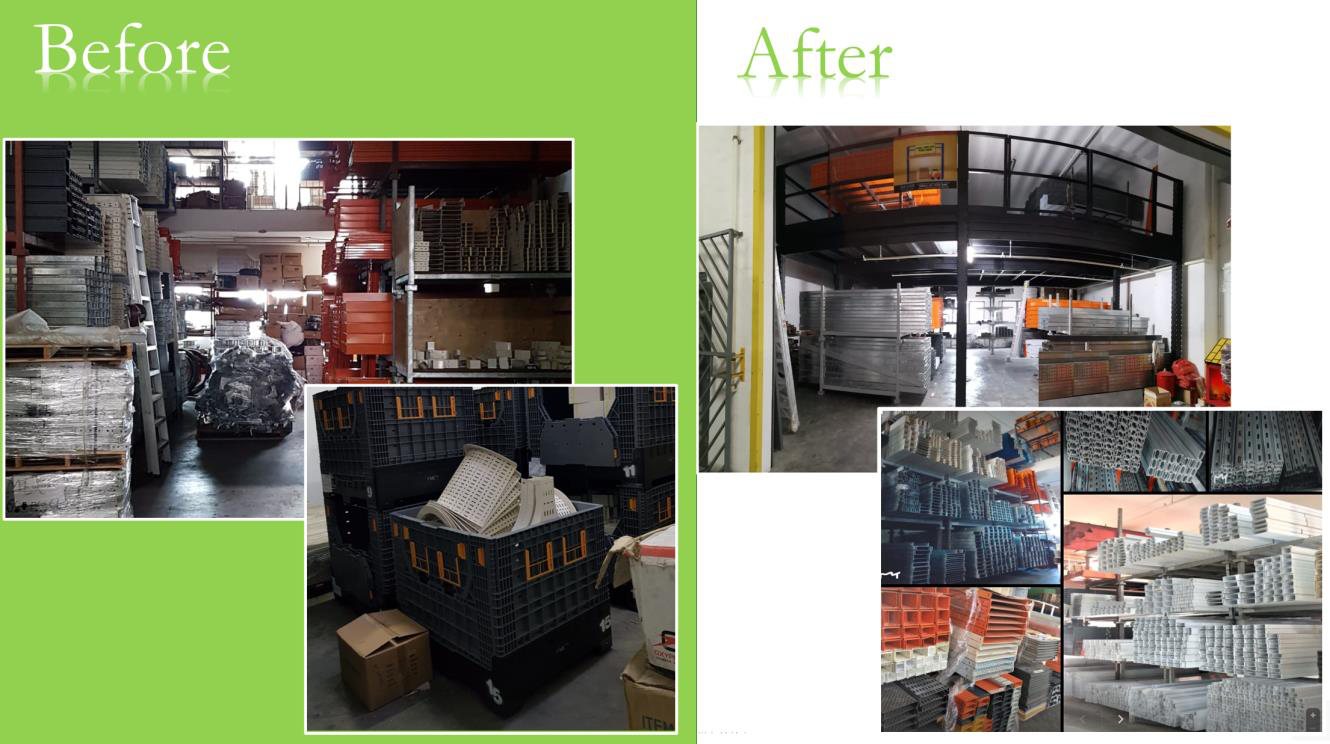
Multiple owners not aligned on direction, with the strongest resistance from the longest-serving staff. No downtime available in a twenty-person company living on daily transactions. And Circuit Breaker, which closed the site mid-project, then reopened it at limited headcount and did not give the timeline back.
What produced each result
Three deliverables, and each one maps to a number at the top of this page.
Scanned inventory tracking, in and out
Scan the location on put-away, scan out when preparing a delivery order. Stock stopped being a memory, which is what stops the company buying what it already owns.
A measured layout and an address that reads like directions
Racking placed against weight, safety and manoeuvring, then every position given an ID that walks you to it: unit, level and zone, column and row.
The stock classification, and the disposal it justified
Ranking every item by movement separated what the warehouse was actively using from what it was only storing. That distinction is what turned “we need more space” into a disposal decision management could sign, and it ran in the same pass as the count so it cost no extra downtime. The barcode generator and the addressing register, which made every position identifiable from zero, are what allowed the count to be done at that granularity in the first place.
The process flowcharts themselves. Inbound and outbound had never been documented. They were drawn purely to create a current state that could be analysed, and became the company's first written description of how it actually operates.